GDP Data Download - Second Modeling Round
Country level GDP data
for Techno Garden, Economic Optimism,
Fortress World and Local Learning (260KB, Excel)
Proposal for the economic assumptions for MA scenarios
Detlef van Vuuren, National Insitute of Public Health and the Environment
April 4 2003
Introduction
The Millennium Ecosystem Assessment intends to use scenarios as one of the main tools to assess the possible future state of ecosystems and their functions for human society under different assumptions. Quantitative modelling is used to support these scenarios. These models will be run using a set of storyline-based assumptions for 'driving forces' such as population, economic developments and technology. Preferably, these assumptions (in particular those not directly related to ecosystem functioning) can be based on available earlier global scenarios exercises that have gone through extensive processes developing socio-economic scenarios. These include IPCC's SRES scenarios and UNEP's GEO scenarios (which were partly derived from the IPCC scenarios). However, IPCC's SRES scenarios have recently criticized heavily on economic growth assumptions, among other for being assuming too high growth rates in developing countries. An initial review in the context of IPCC shows that while the IPCC economic scenarios world-wide seem not outside the realm of possible scenarios, the assumptions for some developing regions should indeed be considered as extremely optimistic (Van Vuuren, 2003). Therefore, the decision has been made to reconsider these economic scenarios for use for in the MA – and in particular, somewhat slow down the improvement of economic growth rates in Africa.
This note discusses the methodology used to develop the new MA economic growth scenarios and its results. In order not to go in complete economic modeling effort, the scenarios proposed are constructed by using the results of published, and well-references scenarios, in particular the World Bank scenarios from the World's Economic Prospects (2003) for medium-term projections and IPCC's SRES for long-term projections.
Methodology
Table 1 shows for the four different MA scenarios the assumed 'qualitative' storyline assumptions. The four scenarios derive a set of scenarios that assume high economic growth for 'Economic Optimism' and low economic growth for 'Fortress World' with the two other scenarios being in the middle of these two extremes (and partly branch off of these).
Table 1: General storyline assumptions MA scenarios
| EconOpt | Technogarden | Fortress | Local Learning | |
| Demography Population growth |
Medium-low | Medium-low | High | Somewhat lower than fortress |
| Economy | ||||
| Income | High | Somewhat lower than EconOpt. Starting to catch up |
I: Medium D:Low |
Starts like fortress and than improves |
| Income distribution | Medium improving | Similar as EconOpt. | Massive inequality – even within the fortress |
Starts like fortress and than improves |
Assuming that IPCC's SRES scenarios could be used as a start for developing the MA scenarios, Figure 1 shows the short-term per capita growth rates of these scenarios for aggregated global regions – and compares them with the medium-long term World Bank scenarios. Table A1 on Appendix A does the same, but now also including longer-term projection and using data from the IMAGE 2.2 implementation of the IPCC scenarios.
Figure 1: Comparison 2000-2015 growth rates between SRES and more recent scenarios
From Figure 1 (and the data in Table A1 on Appendix A) the following conclusions can be derived:
- The IPCC's SRES scenario describe a set of economic scenarios that give a wide-range of different growth projections.
- However, for developing countries in the short run most of the IPCC SRES projection seem to be above World Bank's (medium growth) projections. While in the longer-run we can assume that the assumptions made in the different storylines (e.g. good governance in Economic Optimism) can allow for a wide-range of growth rates, on the medium term it is unlikely that the scenarios will be so-far away from the World Bank economic growth projections.
- For developed regions, the IPCC scenarios show in general lower growth rates than the World Bank projections.
- On the basis of Table 2, but above all on the storyline, in the longer run A1b could well serve as a model for Economic Optimism. A2 could serve as a model for Fortress World. Technogarden has similarities with B1 (but on the long-run it growth rates converges with that of Econ. Opt). Finally, local learning shares many assumptions with B2 – but should in the shorter term be geared more to A2.
The proposal here is to identify three phases in the MA scenarios.
- Until 2015, the regional MA scenarios are based on the World Bank projections, multiplied with a constant factor to include lower/higher growth assumptions.
- From 2015 to 2050, the scenario slowly merges from the modified World Bank growth rates to the growth rates of a chosen IPCC scenarios. It is assumed that in this period, the MA growth rate is a weighted average of the phase 1 (World Bank based) growth rate and that of SRES. The weighting factor moves liniearly from 100% phase 1 to 100% SRES (phase 3).
- After 2050, the MA scenario follows the corresponding IPCC scenario.
The constant factor used in the first phase to somewhat increase/decrease the (medium) World Bank projection has been based on comparing the IPCC scenarios in this period with World Bank projections. Based on this comparison, it was decided to use two different factors for OECD and non-OECD regions. The some what larger range in the factor for non-OECD regions reflect the larger uncertainty in growth rates for these regions.
In order to have more regional detail, for the IPCC scenarios the (officially published) figures of the IMAGE 2.2 model are used. The scenarios have 17 global regions – and are on the level's of the four IPCC macro-regions (OECD, Central Europe/FSU, Asia and other) fully consistent the IPCC marker scenarios. The desegregation to the 17 IMAGE regions has been done using the WorldScan macro-economic model, thus creating a consistent set of regional projection.
The period 1995-2002 is considered to be a historic period in these projections (in contrast to the IPCC scenarios) and based on World Bank data (until 2000) and short-term projections (until 2002).
Table 2: Assumptions for constructing MA growth trajectories on the basis of the World Bank short term projections and IPCC SRES.
| EconOpt | Technogarden | Fortress | Local Learning | |
| Phase 1 (2002-2015) |
Regional World Bank projections multiplied by: 1.25 (OECD regions) 1.55 (non-OECD) |
Regional World Bank projections multiplied by: 1.10 (OECD regions) 1.25 (non-OECD) |
Regional World Bank projections multiplied by: 1.0 (OECD regions) 0.7 (non-OECD) |
Regional World Bank projections multiplied by: 0.85 (OECD regions) 0.85 (non-OECD) |
| Phase 2
(2015-2050) |
Merge from Phase 1 to A1b |
Merge from Phase 1 to B1/A1b mix* |
Merge from Phase 1 to A2 |
Merge from Phase 1 to A2/B2 mix² |
| Phase 3
(2050-2100) |
Uses A1b growth rate | Uses A1b growth rate | Uses A2 growth rate | Uses B2/A1b growth rates |
(*) For Technogarden and Local Learning, the IPCC scenarios to which the Phase 1 growth rate merges is itself based on a merger of two IPCC scenarios to reflect changes in the storyline. Using again a linear combination of two scenarios, Technogarden uses B1 and A1b (which are similar anyway in IPCC SRES) and LL merges from A2 to B2.
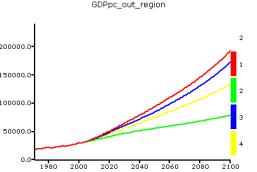
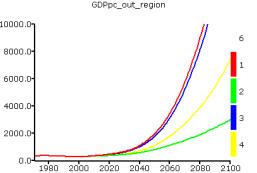
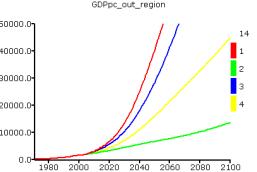
Figure 2-4 shows for some selected regions the result of this method.
Figure 2: Per capita growth rate for USA (left upper), Western Africa (right upper), South Asia (India) (left lower), East Asia (China) (right lower) according to Econ. Optimism MA and A1b SRES. The 5-year spikes in both SRES and MA growth rates are due to linear intrapolation of 5 year step input data. They will simply be removed by only calculating five year steps in the final runs.
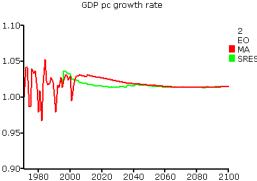
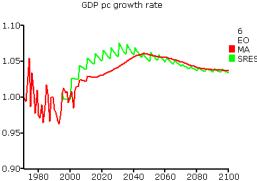
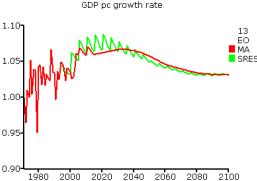
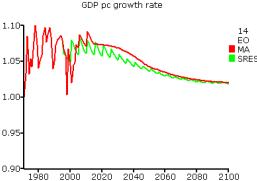
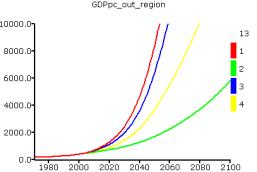
Figure 3: Per capita growth rate for USA (left upper), Western Africa (right upper), South Asia (India) (left lower), East Asia (China) (right lower) according to 4 MA scenarios.
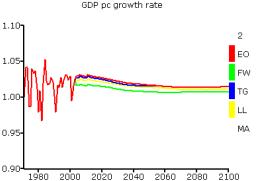
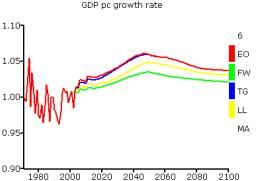
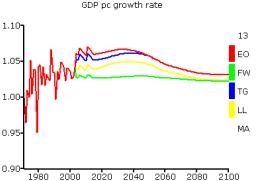
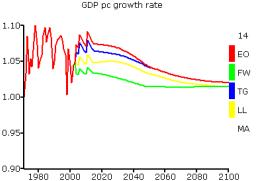
Figure 3: Per capita income for USA (left upper), Western Africa (right upper), South Asia (India) (left lower), East Asia (China) (right lower) according to 4 MA scenarios.
Conclusions
The proposed method is able to create a set of scenarios that are consistent with the short-term projection of the World Bank (correcting the somewhat optimistic short-term projections of SRES) and at the same time a long-term projection that reflects the broad range of projections of IPCC SRES. For low-income regions (and in particular for Africa), the new scenarios show similar long-term growth rates but the scenarios need a somewhat longer development period in which the conditions upon which the storyline builds grow (e.g. human capital and good governance in Africa for Economic Optimism).
SRES scenarios
| Can. | USA | C Am. | S Am. | N Africa | W Africa | E Africa | S Africa | W Eur | C Eur | FSU | Mid.East | S Asia | E Asia | SE Asia | Oc. | Jap. | |
| 2000-2015 | |||||||||||||||||
|---|---|---|---|---|---|---|---|---|---|---|---|---|---|---|---|---|---|
| a1b | 1.8% | 2.1% | 4.0% | 3.6% | 4.3% | 3.9% | 4.4% | 2.9% | 2.2% | 5.5% | 5.6% | 3.3% | 6.7% | 7.0% | 5.0% | 1.8% | 1.2% |
| a2 | 0.9% | 1.4% | 2.8% | 2.5% | 3.0% | 2.4% | 2.8% | 1.6% | 1.3% | 2.5% | 2.5% | 2.2% | 2.4% | 3.1% | 2.0% | 0.9% | 0.6% |
| b1 | 1.8% | 2.0% | 3.9% | 3.5% | 4.2% | 4.1% | 4.6% | 3.1% | 2.2% | 3.9% | 4.4% | 3.2% | 5.2% | 5.3% | 3.6% | 1.8% | 1.1% |
| b2 | 1.3% | 1.7% | 3.0% | 2.6% | 3.4% | 2.5% | 2.9% | 1.6% | 1.7% | 3.2% | 3.4% | 2.6% | 5.7% | 6.1% | 4.8% | 1.3% | 0.8% |
| WB | 2.1% | 2.2% | 1.9% | 1.8% | 1.3% | 1.3% | 1.3% | 1.4% | 2.2% | 2.7% | 3.7% | 1.3% | 3.9% | 4.8% | 4.0% | 2.1% | 1.5% |
| 2015-2050 | |||||||||||||||||
| a1b | 1.8% | 1.5% | 4.8% | 4.4% | 5.5% | 6.1% | 6.5% | 5.1% | 1.8% | 5.0% | 6.0% | 4.6% | 6.7% | 5.3% | 5.2% | 1.9% | 1.3% |
| a2 | 0.7% | 0.6% | 2.5% | 2.2% | 2.9% | 3.5% | 3.8% | 2.7% | 0.8% | 2.6% | 3.0% | 2.2% | 2.9% | 1.7% | 2.3% | 0.7% | 0.6% |
| b1 | 1.4% | 1.0% | 4.5% | 4.1% | 5.2% | 6.0% | 6.3% | 5.0% | 1.4% | 4.0% | 5.2% | 4.3% | 6.2% | 4.4% | 4.5% | 1.4% | 0.7% |
| b2 | 1.1% | 1.1% | 2.9% | 2.5% | 3.4% | 3.9% | 4.2% | 3.0% | 1.2% | 4.0% | 4.7% | 2.7% | 4.9% | 3.9% | 4.3% | 1.1% | 0.9% |
| 2050-2100 | |||||||||||||||||
| a1b | 1.9% | 1.4% | 2.6% | 2.2% | 3.0% | 4.4% | 4.6% | 3.3% | 1.8% | 2.3% | 2.9% | 2.3% | 3.6% | 2.5% | 3.1% | 2.0% | 1.4% |
| a2 | 0.9% | 0.7% | 1.9% | 1.6% | 2.3% | 2.5% | 2.7% | 1.7% | 0.7% | 1.7% | 2.7% | 1.7% | 2.4% | 1.4% | 2.3% | 0.9% | 0.6% |
| b1 | 1.2% | 0.9% | 1.8% | 1.5% | 2.2% | 4.5% | 4.7% | 3.4% | 1.0% | 2.2% | 2.8% | 1.5% | 3.4% | 2.4% | 2.6% | 1.4% | 0.7% |
| b2 | 1.1% | 0.8% | 2.3% | 2.0% | 2.7% | 2.9% | 3.1% | 2.0% | 0.8% | 1.4% | 2.7% | 2.0% | 1.9% | 1.2% | 2.2% | 1.1% | 1.3% |
MA scenarios
| Can. | USA | C Am. | S Am. | N Africa | W Africa | E Africa | S Africa | W Eur | C Eur | FSU | Mid.East | S Asia | E Asia | SE Asia | Oc. | Jap. | |
| 2000-2015 | |||||||||||||||||
|---|---|---|---|---|---|---|---|---|---|---|---|---|---|---|---|---|---|
| EO | 2.5% | 2.6% | 3.0% | 2.9% | 1.9% | 1.9% | 2.0% | 2.1% | 2.7% | 4.1% | 5.2% | 2.0% | 5.7% | 7.1% | 6.6% | 2.5% | 1.9% |
| FW | 2.1% | 2.2% | 1.3% | 1.2% | 0.9% | 0.9% | 1.0% | 1.1% | 2.2% | 2.0% | 2.9% | 1.0% | 2.9% | 3.6% | 3.4% | 2.1% | 1.5% |
| TG | 2.3% | 2.3% | 2.4% | 2.3% | 1.6% | 1.6% | 1.6% | 1.7% | 2.4% | 3.3% | 4.4% | 1.6% | 4.7% | 5.9% | 5.5% | 2.3% | 1.7% |
| LL | 1.8% | 1.9% | 1.6% | 1.5% | 1.1% | 1.1% | 1.2% | 1.2% | 1.9% | 2.4% | 3.3% | 1.2% | 3.4% | 4.2% | 4.0% | 1.8% | 1.3% |
| WB | 2.1% | 2.2% | 1.9% | 1.8% | 1.3% | 1.3% | 1.3% | 1.4% | 2.2% | 2.7% | 3.7% | 1.3% | 3.9% | 4.8% | 4.0% | 2.1% | 1.5% |
| 2015-2050 | |||||||||||||||||
| EO | 2.2% | 2.2% | 4.9% | 4.7% | 4.0% | 4.6% | 4.7% | 3.9% | 2.3% | 4.9% | 5.4% | 3.5% | 6.4% | 6.3% | 6.0% | 2.3% | 1.7% |
| FW | 1.4% | 1.4% | 2.3% | 2.2% | 2.0% | 2.4% | 2.6% | 1.9% | 1.5% | 2.4% | 2.6% | 1.6% | 2.8% | 2.4% | 2.7% | 1.4% | 1.1% |
| TG | 2.0% | 1.9% | 4.4% | 4.2% | 3.7% | 4.3% | 4.4% | 3.6% | 2.0% | 4.2% | 4.7% | 3.2% | 5.6% | 5.3% | 5.1% | 2.1% | 1.5% |
| LL | 1.6% | 1.6% | 3.1% | 2.9% | 2.7% | 3.1% | 3.2% | 2.5% | 1.6% | 3.5% | 3.9% | 2.3% | 4.4% | 4.1% | 4.2% | 1.6% | 1.2% |
| 2050-2100 | |||||||||||||||||
| EO | 1.9% | 1.4% | 2.8% | 2.4% | 3.3% | 4.6% | 4.8% | 3.6% | 1.8% | 2.4% | 3.2% | 2.6% | 3.9% | 2.8% | 3.3% | 2.0% | 1.4% |
| FW | 0.8% | 0.7% | 1.9% | 1.6% | 2.4% | 2.6% | 2.8% | 1.8% | 0.7% | 1.8% | 2.7% | 1.7% | 2.5% | 1.4% | 2.3% | 0.8% | 0.6% |
| TG | 1.9% | 1.4% | 2.8% | 2.4% | 3.3% | 4.6% | 4.8% | 3.6% | 1.8% | 2.4% | 3.2% | 2.6% | 3.9% | 2.8% | 3.3% | 2.0% | 1.4% |
| LL | 1.5% | 1.1% | 2.6% | 2.2% | 3.0% | 3.8% | 4.0% | 2.9% | 1.3% | 2.0% | 3.1% | 2.3% | 3.0% | 2.1% | 2.8% | 1.5% | 1.3% |
back